Fairdrop to Airdrop Calculations
The Following Section describes the WYND token airdrop methodology for stakers and validators of different chains.
The WYND token will be getting airdropped to stakers and validators of various chains through a vesting contract. We analyzed data from a snapshot date of these different chains and designed the formulation of reward shares for each staker & validators engaged at various levels with the chains. Most WYND will be airdropped to many stakers on other chains, and some will be airdropped to validators.
Stakers
We want to reward typical stakers by not losing it for accounts with little stake amount and also don’t want to give massive amounts to whales either. We mapped out the staked amount, balance, and transactions sent for various chains and put this in a chart to analyze the distribution. You can look at this example for Osmosis:
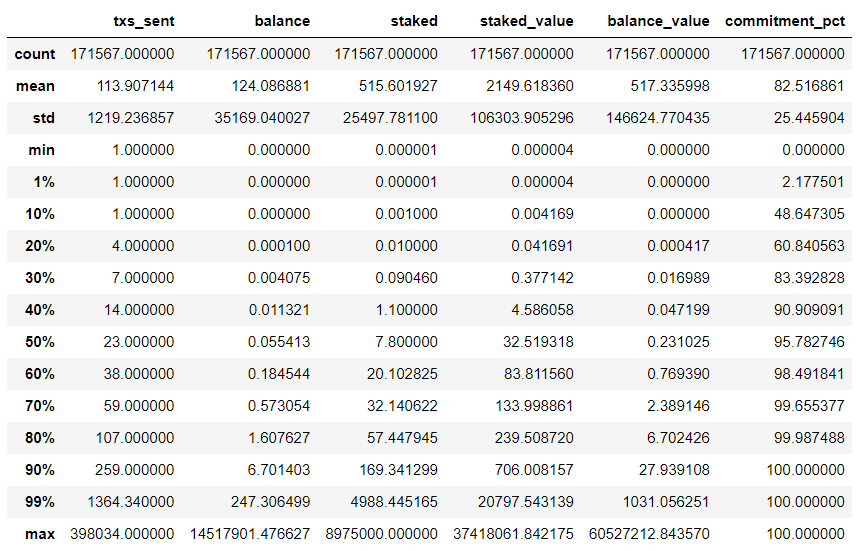
STAKED Tokens :
We noticed that the top 1% has a HUGE amount of money. Those are real whales. Also, after we hit 70% or 80%, the ratio between columns increases significantly. The bottom 20% or 30% have 1 Osmosis or less staked on the bottom side, like dust accounts.
TRANSACTIONs :
The bottom 20% have only sent one transaction ever. Just to stake. The top 1% have sent 100s of transactions to compound their interest. If we draw a 20%-80% line, that will range from 1 tx to 14 tx ever sent, a very reasonable range.
We highly punish the ones that only sent one tx. They never voted nor withdrew any tokens. The ones with three or more are more active.
COMMITMENT :
We created an indicator for commitment level by finding the percentage of tokens staked compared to total token holdings and rewarded those with higher commitment to stake compared to the balance of the account.
Formula :
We use piecewise linear curves for all items, constant above a minimum and maximum.
Given user $X$ is percentile $\rho$ in some metric (staked,balance,transactions,commitment), we define the reward formula as :
Reward(R)= func(p, a, b, min, max)
    =a ; if p < min
    =b ; if p > max
    =a + ((b-a) * (p-min)/(max-min)) ; otherwise
Where a,b are for percentile cutoffs over a range of points in terms of min,max.
We chose the following values for calculating individual reward points for each feature, i.e., stake points, transaction points, and commitment points, to be utilized as a multiplier for the final points calculation for a wallet.
stake points = Reward(p(staked), 20, 80, 0, 100)
tx multiplier = Reward(p(txs), 30, 90, 1, 23)
commitment multiplier = Reward(p(commit), 0, 100, 1, 3)
Total Shares = (stake points * tx multiplier * commitment multiplier)
Finally, we allocate the Percentile Rank for every wallet based on this total share score. If they get the same score, the maximum rank is assigned to each wallet.
Validators
We will also reward validators from various chains. We want to reward active validators. Not just the big guys. And we want to manually filter out centralized exchanges or other “problematic” characters. We will manually make a “deny list” of validators that are either centralized exchanges, anyone offering “0% 0r 100% fee”, or otherwise known “scammy” actors in the ecosystem. These will be removed from the validator list before making all percentiles and other calculations.
For validators’ snapshot data, we mapped token staked, commission fees, and several delegators for proceeding with our formula to allocate scores to all validators active on different chains. Validators distribution on osmosis after applying initial filters, we see the following:
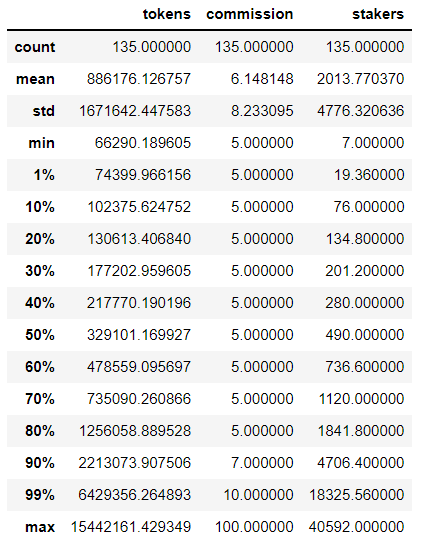
Token Staked :
There is only about a 10x change between 20% and 80%. The other extremes are pretty extreme. A 10x between the most significant and most minor seems relatively fair.
Number of Delegators :
Between 20% and 80%, there is a 20x difference. I am not sure this is such a critical criterion at higher levels, but mainly to differentiate those who have relatively few and those who have a larger group. The 40% is already almost 500 delegators (while 1% is only 30). Let’s provide a multiplier over this low section and saturate at 40% (so all the rest get the same multiplier - basically a punishment for the low end)
- 0 percentile -> 20% multiplier
- 10 percentile -> 40% multiplier
- 20 percentile -> 60% multiplier
- 30 percentile -> 80% multiplier
- 40+ percentile -> 100% multiplier
Formula : Similar to the stakers formula used above, we calculated points based on total staked tokens by the validators and the number of delegators they have to be used as a multiplier for calculating the total shares.
token points = Reward(\rho(tokens), 20.0, 80.0, 10, 100)
delegators points = Reward(\rho(stakers), 0.0, 40.0, 0.2,1)
Total Shares = (token points * delegators points)
Finally, we allocate the Percentile Rank for every wallet based on this total share score. If they get the same score, the maximum rank is given to each wallet.